Best Time to Visit Costa Rica: Dry and Rainy Season, Region by Region
Verified on 26 August 2026, against the Instituto Meteorológico Nacional’s own regional climatology documents. Every figure comes from IMN’s 1961–1990 baseline — see the note near the end.
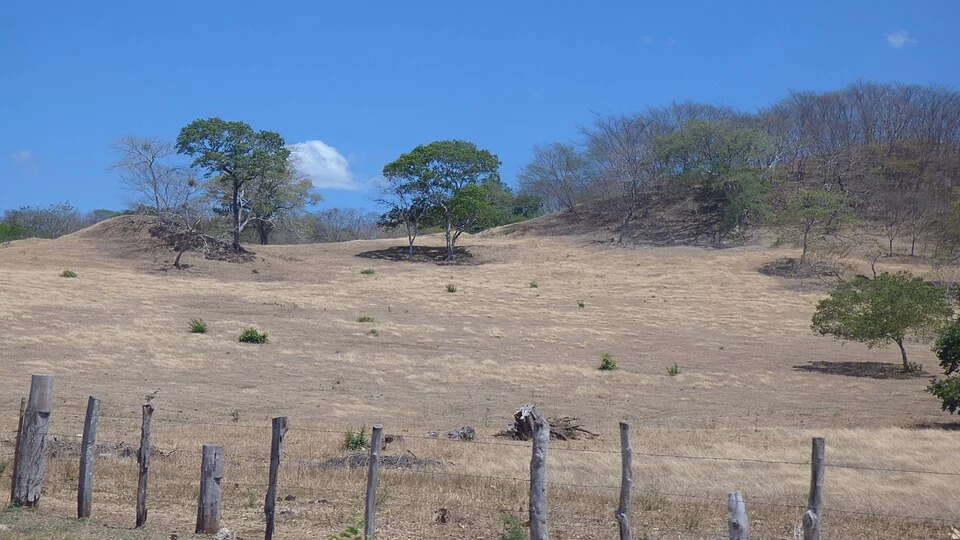
There is no single Costa Rican season. IMN divides the country into seven climate regions, and the two slopes run opposite cycles. On the Pacific slope the dry season runs December to March in IMN’s national regionalisation — though IMN’s own Pacífico Central document narrows that region’s dry period to January–March, with December a transition month. On the Caribbean slope there is no defined dry season at all: rainfall stays between 100 and 200 mm even in the least rainy months, and the wettest month of the year is December.
The data describes a country where “season” is a regional variable rather than a national one, and where the two coasts’ driest windows do not overlap — the Caribbean’s September–October rainfall dip (a relative minimum in IMN’s data, not a true dry season) lands exactly on the Pacific slope’s two wettest months.
Season by region
IMN names its seven regions as Pacífico Norte, Pacífico Central, Pacífico Sur, Región Central, Zona Norte, Región Caribe Norte and Región Caribe Sur. All seven are covered by the six published climatologies read here — Caribe Norte and Caribe Sur share a single Vertiente Caribe document, which is why they share a row below — and that is what this table is built from. Pacífico Sur’s document does not publish an extractable annual rain-day count, which is why its rain-day cell is empty.
| IMN region | Towns it covers | Driest window | Rainy period(s) | Rain days a year | Annual rainfall |
|---|---|---|---|---|---|
| Pacífico Norte | Tamarindo, Guanacaste, Nicoya | December–March (4% of annual rain) | May–August (50%), September–November (46%) | 136 | 1,500–2,500 mm |
| Pacífico Central | Quepos, Manuel Antonio | January–March (4%) | May–August (52%), second period (44%); December a transition month | 166 | 3,500 mm (valley zone) |
| Zona Norte | La Fortuna, Arenal | — | one single period, May to December or January | 199 | more than 3,200 mm |
| Región Central | San José and the Central Valley | December–March | May–October; April and November transition months | Valle Occidental 148 / Valle Oriental 163 | Occidental 2,300 mm / Oriental 1,700 mm |
| Pacífico Sur | Uvita, the Osa Peninsula, Golfito | January–March (11%); April a transition month | May–August (43%), second period (46%); December a transition month | not published in the document read | more than 4,500 mm (2,500–3,000 mm in the high cordillera) |
| Caribe Norte / Caribe Sur | Tortuguero, Limón, Cahuita, Puerto Viejo | none defined; two relatively dry windows, February–March and September–October | November–February (40%), April to August–September (46%) | Norte 195 / Sur 184 | ~3,300 mm (4,500 mm in the northeast, 2,700 mm at the southern minimum) |
Read the rain-day column across and the spread is 63 days: Guanacaste records 136 rain days a year, the Arenal region 199 — the lowest and highest of every region with a published rain-day count here (Pacífico Sur’s document does not publish one, and IMN calls that region one of its two rainiest). IMN separately ranks Zona Norte the country’s third rainiest region, beaten only by Pacífico Sur and Caribe Norte.
Two of those Zona Norte figures reconcile against each other. IMN states that each cold front contributes about 6% of the region’s annual total, or 195 mm; 195 mm at 6% implies about 3,250 mm a year, consistent with the “more than 3,200 mm” printed in the same document.
The Caribbean’s two named rainy periods carry 40% and 46% of annual rainfall — 86% between them by our arithmetic, leaving roughly 14% for March and the September–October window.
The Central Valley is two valleys, and the wetter one has fewer rain days
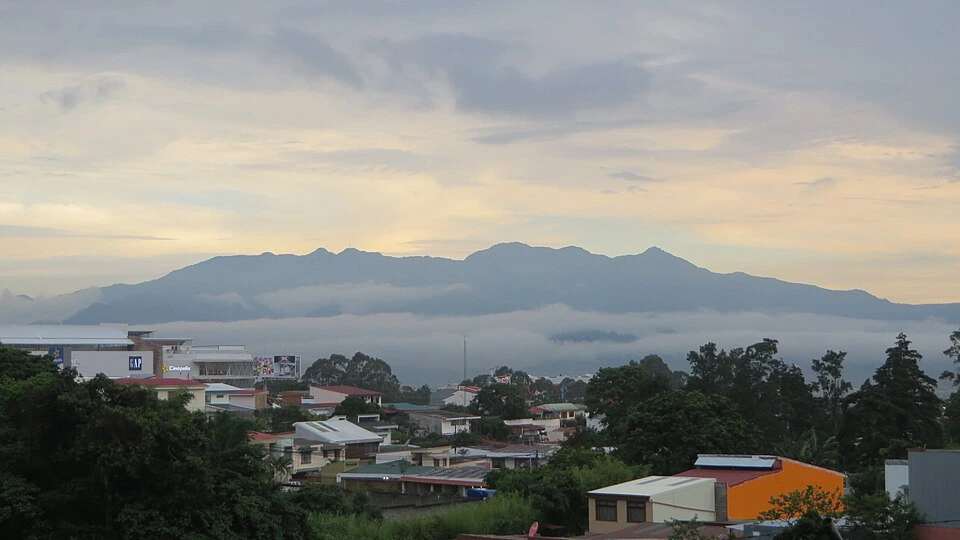
IMN splits the Central Valley in two. The Valle Occidental averages 2,300 mm a year across 148 rain days; the Valle Oriental averages 1,700 mm across 163 rain days. The drier valley rains on more days. The same document records the wettest single point in this series — the Tseis weather station near Orosi, Paraíso de Cartago, averaging more than 7,000 mm a year.
What a “dry season” actually means depends on where you stand
IMN publishes the comparison directly: during January to March, more than 100 mm of rain can still accumulate in the Valle Oriental, while the Tempisque depression in Guanacaste accumulates 20 to 50 mm over those same three months. Both are called dry season.
Within Pacífico Norte itself the Tempisque depression is the driest zone at about 1,700 mm a year, the Nicoya peninsula about 1,900 mm, and the Guanacaste and Tilarán mountains about 2,200 mm.
When in the day the rain falls — and it differs by coast
- Pacific slope: “Las lluvias ocurren predominantemente durante la tarde y primeras horas de la noche” — predominantly afternoon and early evening.
- Caribbean slope: “Las lluvias ocurren con mayor probabilidad en horas de la noche y la mañana” — most likely at night and in the morning.
The mid-year dry spell has a name
IMN records a veranillo de San Juan at the end of June in the Central Valley — described as short — followed by a longer July–August reduction in both rainfall and rain days, known as the canícula or veranillo. The same July–August dip appears in the Pacific-slope description.
On the Caribbean side, July is a rainfall peak, not a dip: IMN’s national regionalisation document puts the Caribbean’s second rainy period at May to August, “con un máximo en julio que coincide con el veranillo del Pacífico” — with a maximum in July that coincides with the Pacific’s veranillo.
Two IMN documents date that Caribbean period differently, and we do not reconcile them. The regionalisation document just quoted says May to August. The separate Vertiente Caribe regional climatology says the period “se inicia en abril y finaliza en agosto-setiembre” — April to August or September — and puts 46% of annual rainfall in it. Both are IMN, both are quoted as published, and neither is adjusted to fit the other. The region table above uses the Vertiente Caribe months because that is the document written about the region.
The Pacific slope’s wettest months are September and October. March is its driest and warmest month.
Temperature
Only Pacífico Norte and Pacífico Central publish temperature figures in the documents read:
| Zone | Day | Night |
|---|---|---|
| Tempisque depression (Guanacaste interior) | 32 °C | 22 °C |
| Nicoya peninsula | up to 33 °C | 22 °C |
| Guanacaste / Tilarán mountains | 25 °C | 17 °C |
| Pacífico Central (Quepos, Manuel Antonio) | average maximum 31.0 °C | average minimum 22.7 °C |
Mean annual temperature range: 9.1 °C in Pacífico Norte, 8.8 °C in Zona Norte.
El Niño and La Niña move Guanacaste materially
This is the largest single source of year-to-year variation IMN quantifies, and it is concentrated on the dry Pacific northwest:
- An extreme dry event cuts Pacífico Norte rainfall by 417 mm — a 26% annual deficit — and up to 24 fewer rain days.
- 79% of extreme dry events are associated with El Niño. La Niña carries a 60% probability of producing a wet scenario.
- An extreme wet event adds 544 mm, a 28% increase.
On the Caribbean the same extremes are smaller in one direction and larger in the other: dry events reduce annual rainfall by up to 24% and 17 to 20 rain days in both subregions; wet events raise it 32 to 35% with about 23 extra rain days.
The baseline these numbers come from
Every figure above sits on IMN’s climate baseline for 1961–1990, built at annual and monthly level from 81 stations, of which 50 had precipitation records covering the full period and were updated to 2006. These are long-run averages. They are not a forecast and not this year’s weather.
What the meteorological service doesn’t publish
These are gaps in the published record, not conclusions we reached:
- Month-by-month rainfall in millimetres for individual towns. IMN publishes the monthly climatology as regional charts inside these documents (Figura 2, 7, 24, 29). The underlying monthly values are rendered as graphics and are not extractable as text, so only the regional annual totals and per-season percentage shares above can be quoted.
- A current-decade climate normal. Everything here is 1961–1990; IMN’s Atlas Climatológico uses 1961–1980. A 1991–2020 normal for Costa Rica could not be found.
- Monteverde. IMN’s regionalisation puts Monteverde on the Cordillera de Tilarán boundary between Pacífico Norte and Zona Norte — two regions 63 rain days apart — and no separate Monteverde climatology was published in this series. Both regions’ calendars are set side by side on our Monteverde page.
- A Pacífico Sur rain-day count. Its regional document (read 29 August 2026) publishes the seasonal shares and rainfall range in its table row above, but no extractable annual rain-day figure. And IMN does not rank Pacífico Sur against Caribe Norte in any document read here, so neither of the two can be called the country’s rainiest on this evidence.
- The term “green season”. IMN uses only época seca and época lluviosa. “Green season” appears in no IMN document read here, so it cannot be attributed to the meteorological service.
How we researched this
Scope: this page reports source research, not an on-site test. We checked the booking systems, timetables and official sources named below on the date shown; calculations, unresolved disagreements and information we could not verify are labelled explicitly.
We read the Instituto Meteorológico Nacional’s own published climatologies on 26 August 2026 (Pacífico Sur’s on 29 August 2026): the national regionalisation document, plus the separate regional documents for Pacífico Norte, Pacífico Central, Pacífico Sur, Zona Norte, the Vertiente Caribe and the Valle Central. Every percentage share, rain-day count, rainfall total and temperature figure above is quoted from those documents in Spanish and rendered here in English; nothing is averaged across regions and no figure is carried from one region to another.
Three numbers on this page are our own arithmetic on IMN’s published values, and are labelled where they appear: the 63-day rain-day spread, the 14% Caribbean residual, and the 3,250 mm implied by the cold-front share.
Last verified: 26 August 2026. The underlying baseline is fixed at 1961–1990; what can change is IMN publishing a newer normal.
Figures on this page labelled our arithmetic are calculated by us from the sourced inputs cited below — comparisons, percentages, multiples, differences, per-night and per-person conversions, running totals and currency conversions. Every other figure is reproduced as its named source published it. Where an operator or authority publishes a per-person or per-night rate directly, that is their figure and it is attributed to them at the point it appears.
Sources
- IMN — Regionalización climática de Costa Rica — the seven regions; the Pacific dry season December–March and March as its driest and warmest month; the Pacific rainy season May–October with the July–August veranillo and September–October as wettest; the Caribbean’s absence of a defined dry season and its 100–200 mm floor; the Caribbean’s February–March and September–October dry windows; December as the Caribbean’s wettest month; the Caribbean’s May-to-August second rainy period and its July maximum; time-of-day rainfall on both slopes; the 1961–1990 baseline and its 81-station / 50-station composition.
- IMN — Pacífico Norte — the 4% / 50% / 46% seasonal shares; the 1,500–2,500 mm range with the Tempisque, peninsula and mountain figures; 136 rain days; all Guanacaste temperatures and the 9.1 °C range; every El Niño and La Niña figure.
- IMN — Pacífico Central — the 4% / 52% / 44% shares and the December transition; the 3,500 mm valley average; 31.0 °C and 22.7 °C; 166 rain days.
- IMN — Zona Norte — the single May-to-December-or-January rainy period; more than 3,200 mm; the third-rainiest ranking behind Pacífico Sur and Caribe Norte; 199 rain days; the 8.8 °C range; the 6% / 195 mm cold-front contribution.
- IMN — Pacífico Sur — the January–March dry period with April as transition and its 11% share; the May–August 43% first rainy period, the 46% second period and December as transition; the more-than-4,500 mm annual figure and the 2,500–3,000 mm high-cordillera range; the July–August peninsular veranillo. Read 29 August 2026.
- IMN — Vertiente Caribe — the ~3,300 mm regional average with the 4,500 mm and 2,700 mm extremes; the November–February 40% and April-to-August–September 46% period shares; 195 and 184 rain days; the Caribbean extreme-event percentages.
- IMN — Clima del Valle Central — Valle Occidental and Valle Oriental rainfall and rain days; the December–March and May–October pattern with April and November transitions; the 100 mm versus 20–50 mm dry-season comparison; the veranillo de San Juan and the canícula; the Tseis station figure.
Written by Estuardo Enriquez. This site is independent, has no relationship with any agency or operator named here, and is not connected to any previous owner of this domain.